The Digital Fundraising Performance Index.
A quarterly benchmark for nonprofit Google Ads performance.
Each report tracks Brand, Non-Brand, and PMAX performance to show where fundraising programs are gaining efficiency, building donor volume, or losing momentum.
LATEST ISSUE: Q2 2026
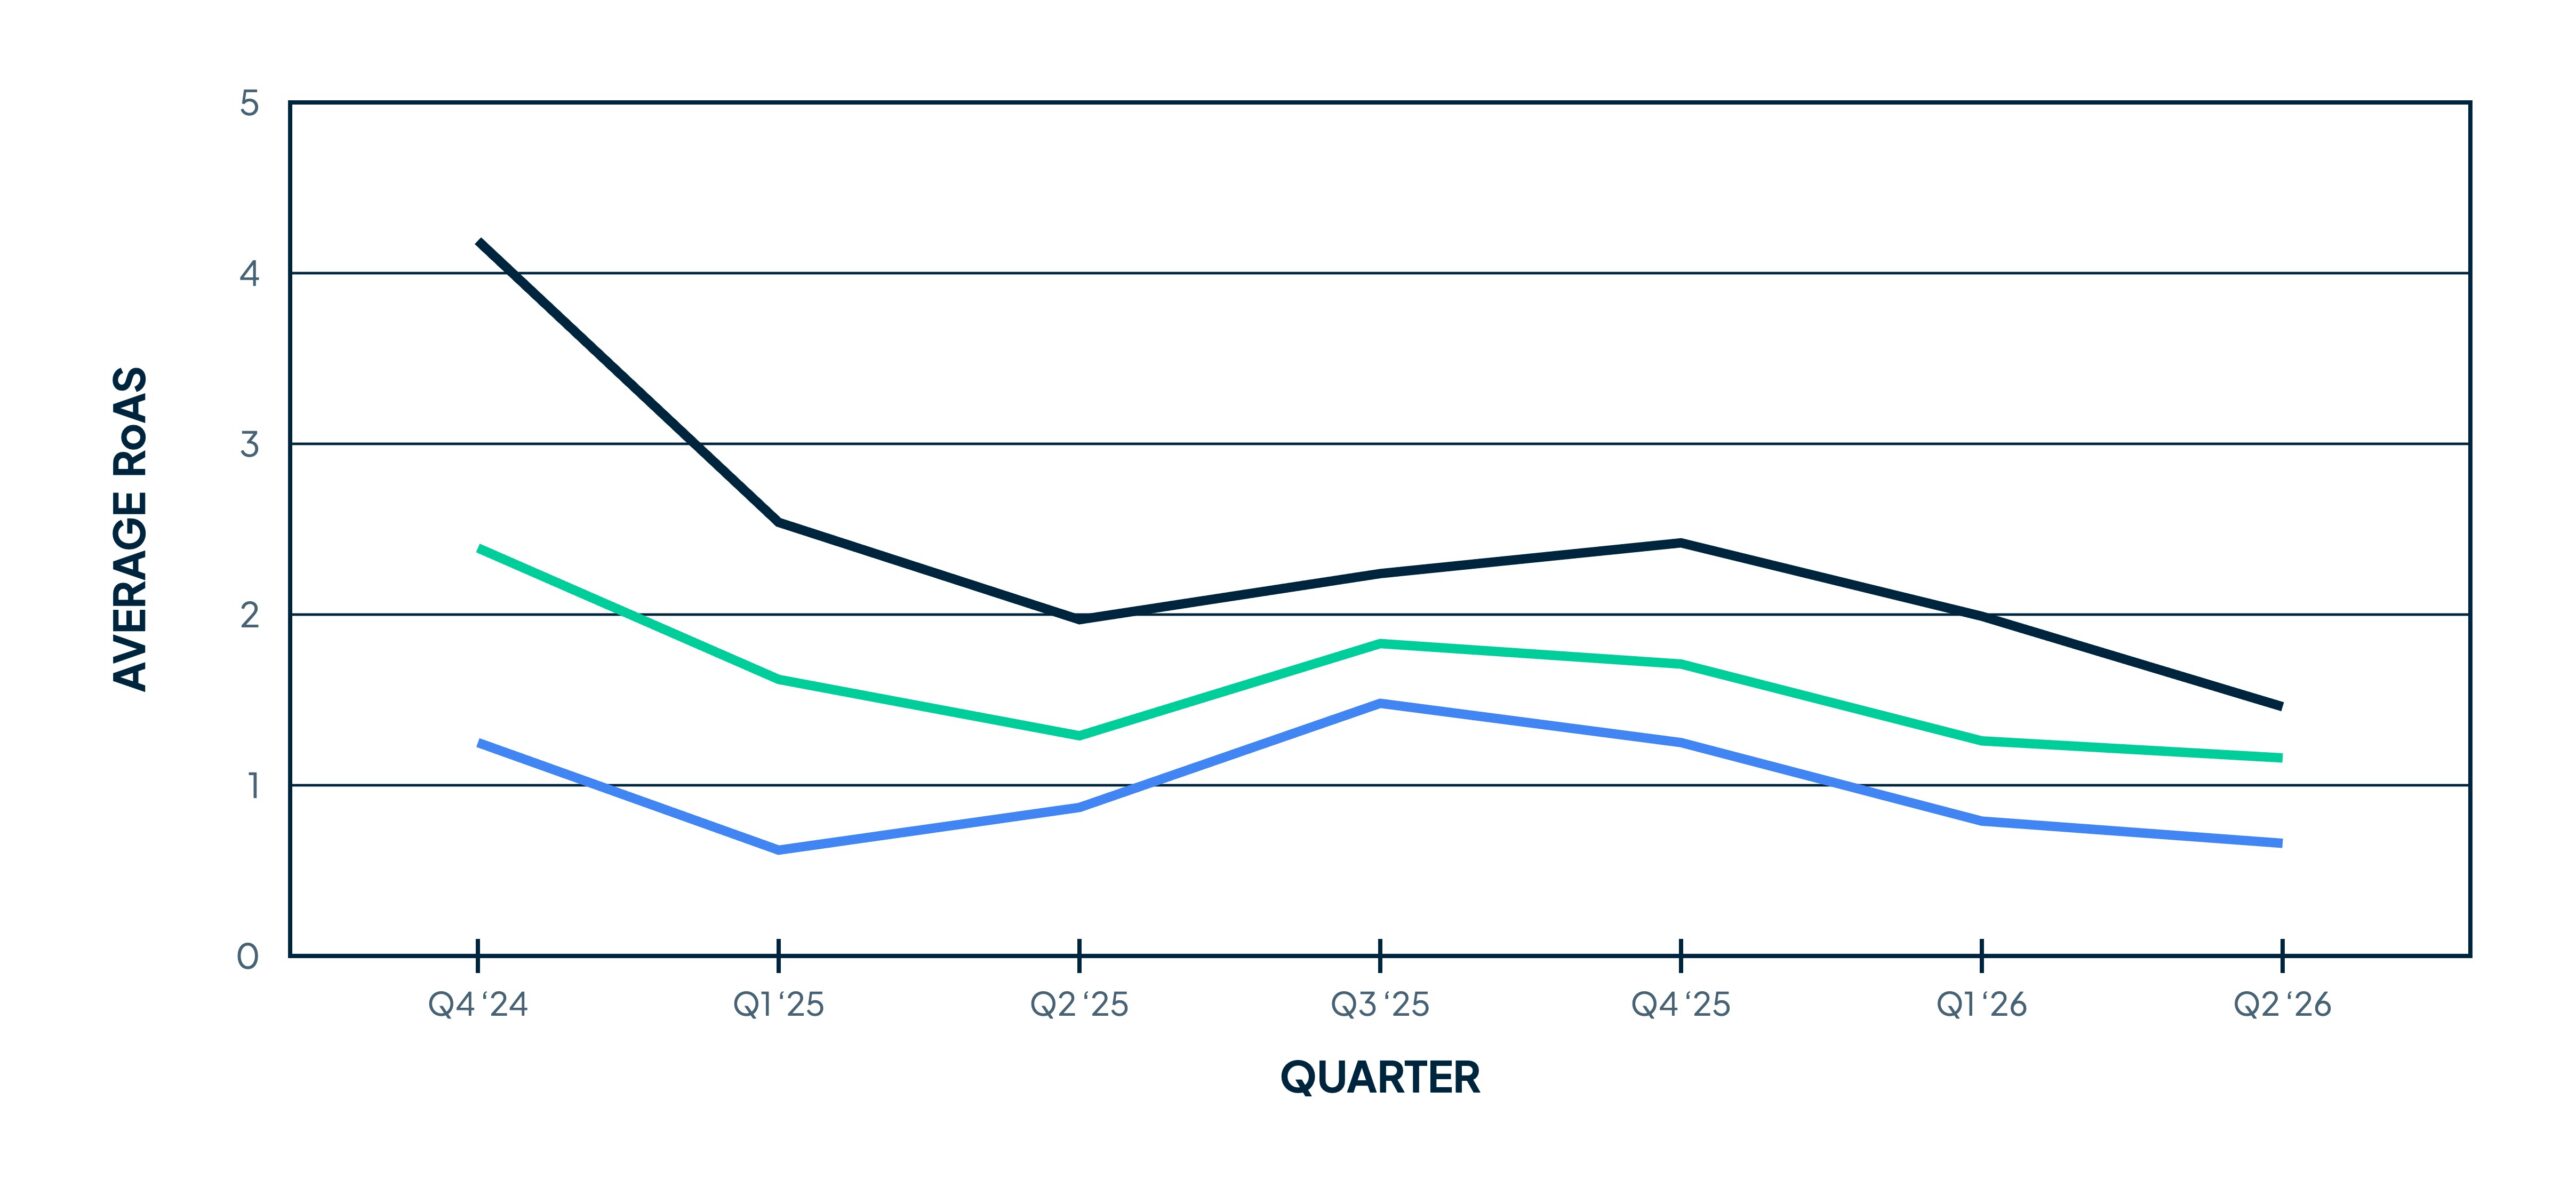
Q4 peaks. Q2 shows what holds.
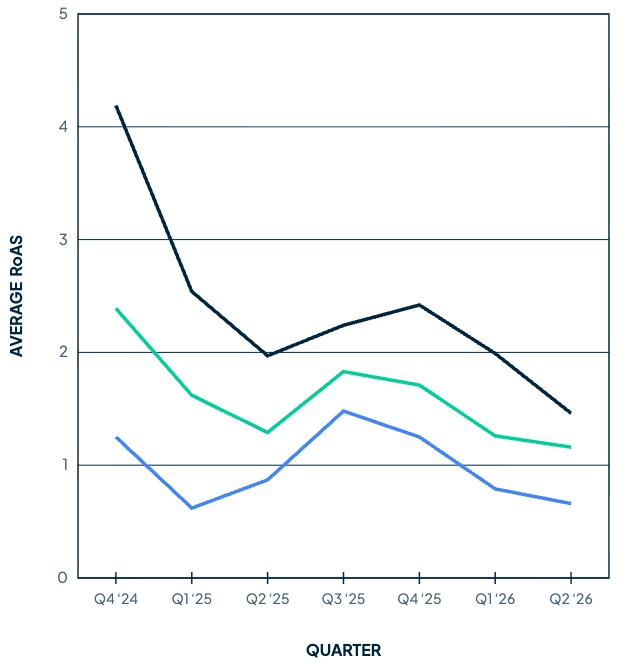
Rolling RoAS by Campaign Type: Q4 2024 – Q2 2026
Brand
PMAX
Non-Brand
Three insights from this issue.
Managed Search keeps winning
Brand and Non-Brand Search combined out-returned PMax in all seven quarters.
Automation got bigger, not better
PMax carried 58% of reported donations in Q2, yet its average RoAS fell from 1.29x to 1.16x.
Brand RoAS dipped while cost per donation improved
A sign to look at gift value and attribution before cutting budget.
Get the full report.
Previous benchmark reports.
The Execution Gap is Widening
Q1 2026
The strongest programs are pulling ahead because they are managed more consistently year-round.
Interpreting Q4 2025 Digital Fundraising Results
Q4 2025
A look at RoAS, donation count, and cost per donation across dozens of non-profit campaigns.