5 Google Ads Trends Nonprofits Should Watch Before Q4
For nonprofit fundraisers, Q3 is more than the stretch between the summer slowdown and year-end giving. It’s the opportunity to look at what’s happening now and make changes before donor demand picks back up in Q4.
Our upcoming Q2 Digital Fundraising Performance Index looks at Google Ads performance across Brand Search, Non-Brand Search, and Performance Max (PMAX). With seven consecutive quarters of data now in the series, we’re seeing several trends that nonprofit teams should be paying attention to as they prepare for year-end.
The goal isn’t to wait until Q4 to find out what worked. It’s to spot the direction early enough to do something about it.
1. Watch how quickly Brand Search recovers.
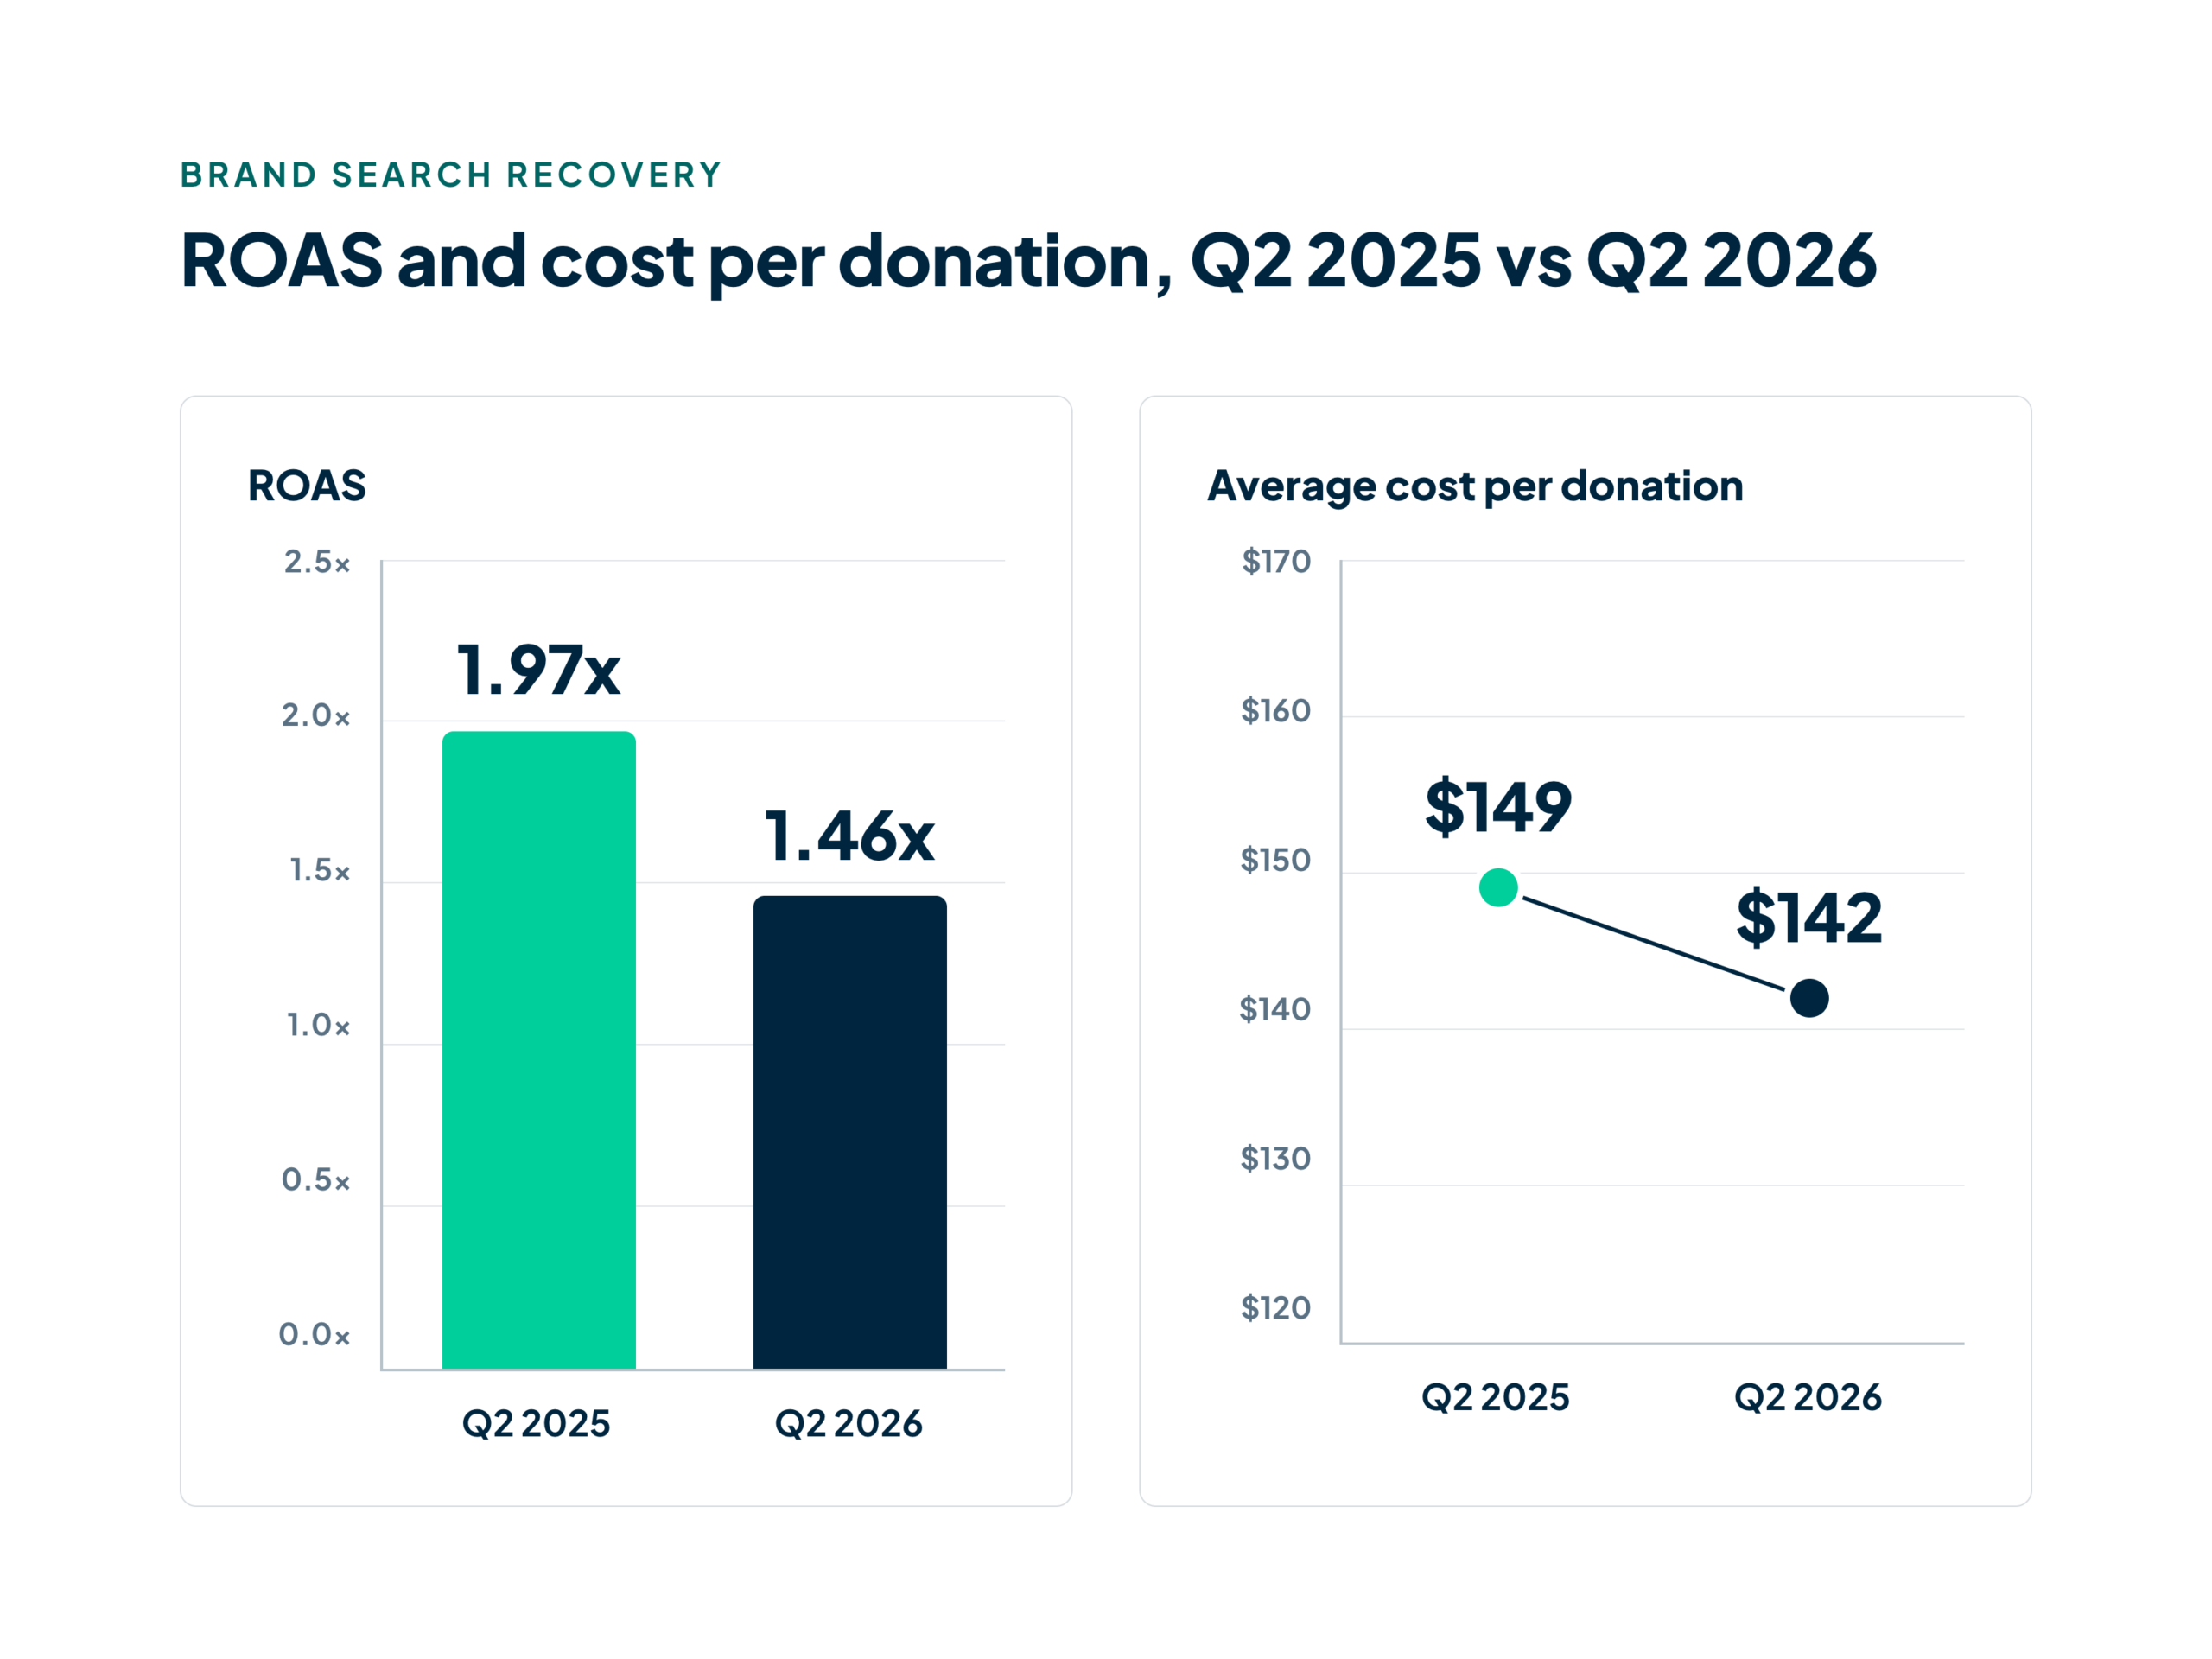
Brand remains the strongest-performing campaign type in our benchmark, but ROAS alone doesn’t tell the whole story. Cost per donation matters too.
Heading into Q4, watch these metrics together. If ROAS improves while cost per donation stays steady or declines, that’s a positive sign. If both worsen, take a closer look at donation value, search queries, landing pages, and attribution before increasing budgets.
2. Keep watching Managed Search vs. PMAX.
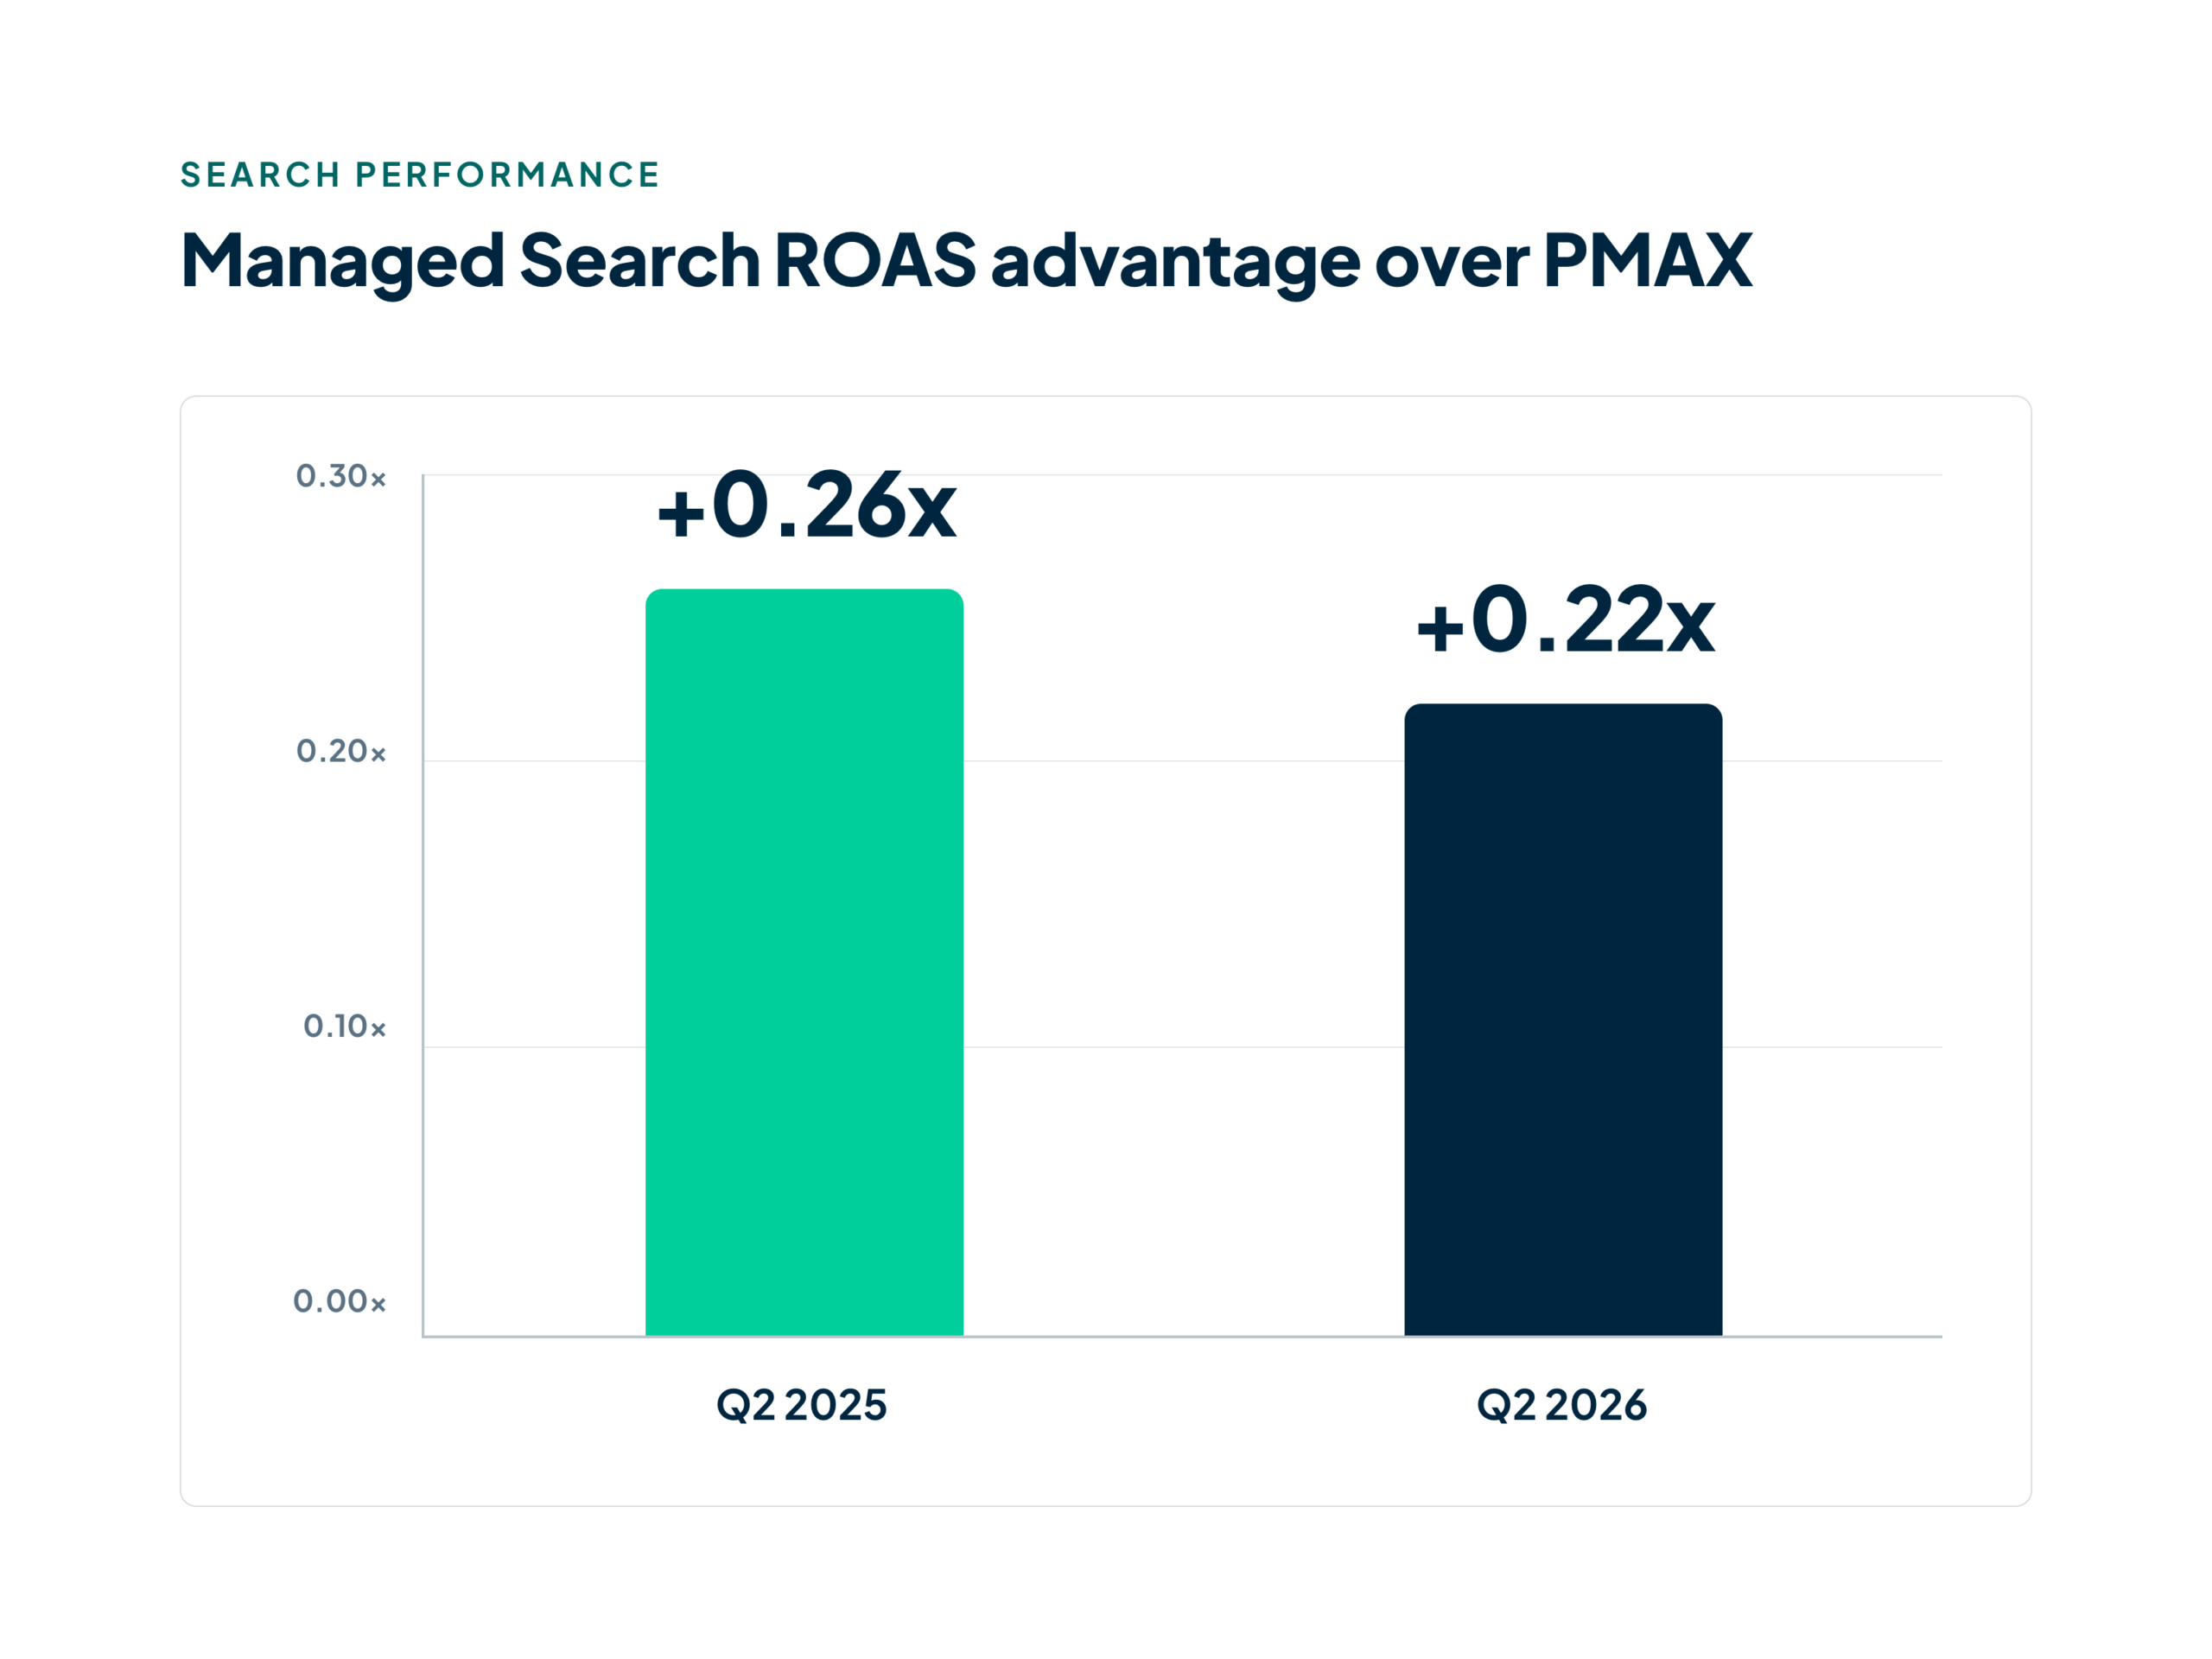
Managed Search continued to outperform PMAX in Q2, with a 0.22x ROAS advantage. A year ago, that advantage was 0.26x.
The gap has narrowed slightly, but Managed Search still has the edge. The question heading into Q4 is whether actively managed Brand and Non-Brand Search continue to generate stronger returns than PMAX—especially for organizations putting a large share of their Google Ads budgets into PMAX.
3. Make PMAX earn its share of the budget.
PMAX accounted for 58% of reported donation volume in Q2, even as its program-average ROAS declined.
The largest long-term PMAX investments in our benchmark also did not close the efficiency gap with Managed Search. That doesn’t mean PMAX has no role in the portfolio. It means the role needs to be intentional.
Rather than allowing PMAX to become the default largest channel, use it as a lean, steady automated baseline. Expand its share only when ROAS and cost per donation show that it is earning the additional investment.
4. Use Q3 to test Non-Brand Search.
Only five organizations in our Q2 benchmark had active Non-Brand campaigns, so the 0.66x average ROAS isn’t enough to make a broad conclusion about the campaign type.
Instead, use Q3 as a testing window. Test search themes, landing pages, audiences, and cost targets now so you have a better understanding of what deserves investment when year-end demand returns.
5. Don’t stop at the initial donation.
ROAS, donation volume, and cost per donation are important, but they only tell you what happened at the point of acquisition.
They don’t tell you whether that person is a first-time donor, becomes a monthly sustainer, gives again, or ultimately becomes a high-value donor.
That distinction becomes even more important when comparing campaign types. More donations at a lower cost don’t necessarily create more long-term value if those donors never give again.
As you evaluate Q3 and prepare for Q4, start looking at sustainer conversion, donor retention, and lifetime value alongside your acquisition metrics.
Don’t Wait for Q4 to Tell You What Worked
Q2 shouldn’t determine your Q4 strategy, but it should inform it.
Use Q3 to figure out what deserves more investment, what needs to be fixed, and what still needs to prove its value—before year-end demand arrives.
We’ll dig deeper into these trends, along with seven quarters of Google Ads fundraising benchmarks, in our Q2 2026 Digital Fundraising Performance Index coming in October.
Get the must-read newsletter for digital fundraisers.
Written by Delve Deeper team members in the thick of the work, the newsletter explores practical solutions for challenges like disconnected data, weak segmentation, lack of personalization, and inefficient media.